Thursday Thoughts: Partner Reaction to Year-End Giving Data

Welcome to another installment of Thursday Thoughts, a dedicated space for our friends in nonprofit sector leadership to reflect on reports, statistics, and other trends—because when our community shares knowledge, we can all do more good. Check out last month’s post here!
Year-end fundraising season is always busy—and 2021 was no exception. Here at EveryAction, we published a few of our own findings about how organizations fundraised, emailed, and more on our platform during the last week of 2021 (spoiler alert: it was a record-breaking week!). However, we were curious about what our partners witnessed across the sector, how these results compare to previous years, and what they could mean for the future. Here’s what our friends at One & All said.
One & All
If we only had a crystal ball…
“Can you quantify the COVID bump?” or “Is the COVID bump over?” are probably two of the most frequently asked questions of analysts in the social good marketing space today. With organizations closing their 2021 books, we took an early look into comparing performance pre-pandemic (2019 and prior) to 2020 and 2021.
Based on analyzing data through calendar year end from a few dozen human services clients, we have a few early insights on supporter behavior for social good organizations in the space.
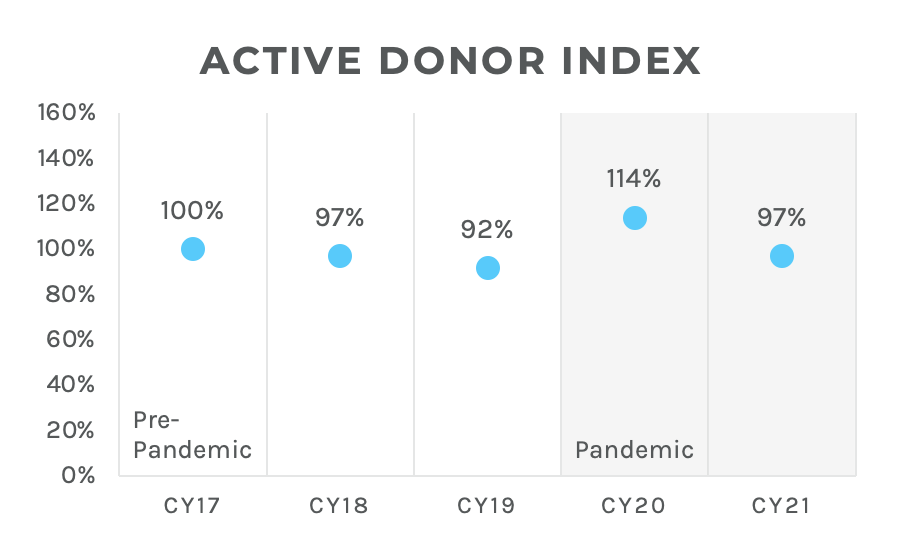
Active donors have returned to pre-pandemic levels. Indexing 2021 active donors against pre-pandemic performance, 2021 active donors were above 2019 active donors (92 percent in 2019 vs. 97 percent in 2021 when indexed against 2017). New donor acquisition had similar indexes.
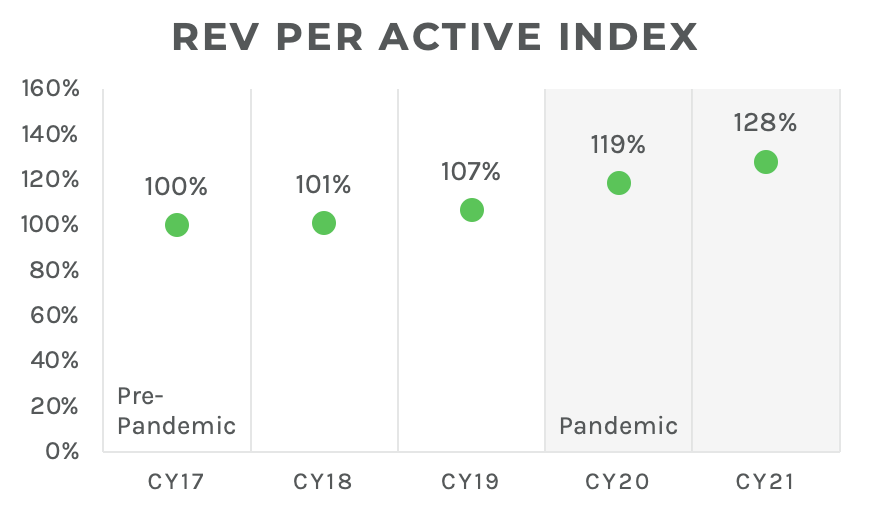
Higher revenue per active donor is here to stay. While overall 2021 revenue differences varied by organization compared to 2020, revenue per donor is 28 percent above pre-pandemic levels. This increase in revenue (compared to pre-pandemic) is fueled by increases in both average gift (up 14 percent) and gift frequency (up 13 percent). The pandemic saw an increase in digital giving, which brings in a higher average gift, and sustainer giving, which increases gift frequency. Organizations focusing on these areas have seen the highest increases in revenue per active donor.
So, what is the new normal? These early insights show that the COVID bump resulted in unusual 2020 performance, but 2021 has shown a slow but gradual regression towards pre-pandemic performance in many areas. While a large number of donors were activated in 2020 (114 percent index), the lower-than-average retention rates in 2021 signal that many of these donors were motivated by the needs from the pandemic versus the ongoing missions of the organizations. While the increases in donor activation from 2020 are probably over, the pre-pandemic theme of increases in revenue per active donor continue well into the pandemic and likely beyond.
Our Take
One & All’s sample showed that focusing on sustainers and digital fundraising are strong strategies for raising more funds from active donors—and we have to agree! We’ve seen how sustainers’ longer donor lifetime values help nonprofits raise more for their missions, and how digital fundraising can help organizations meet donors where they’re at, no matter where they live. Download our guide to the Future of Fundraising to learn more about optimizing your sustainer program for the long haul, and talk to us to learn more about how the right platform can help you meet the fundraising moment.